
Visualize Service Technician Productivity with
Dynamic Drillable Charting
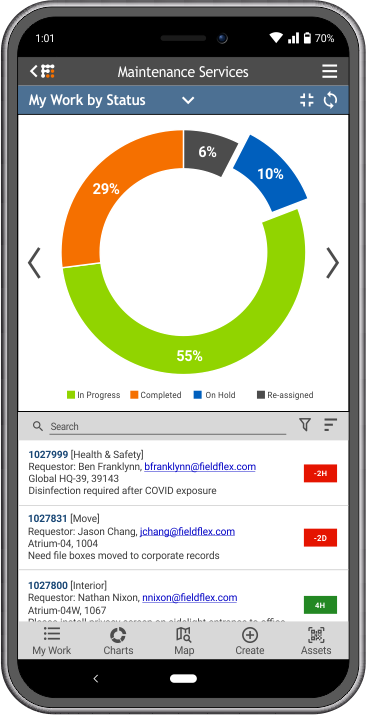
BI with Dynamic Drillable Charting
1. View and drill-in on work by status, request class, location, team, technician, etc
- Visualize your data
- Improve clarity for both technicians and managers
2. Swipe to see other chart styles
- Improved usability and adoption
3. Get visibility into worker productivity by reviewing completed tasks, including average hours per work tasks per week or by technician; number of work tasks completed per week by technician
4. See how technicians, teams, and contractors perform against SLAs.
Need More Information?
Our dedicated care and support team is always available to assist you.